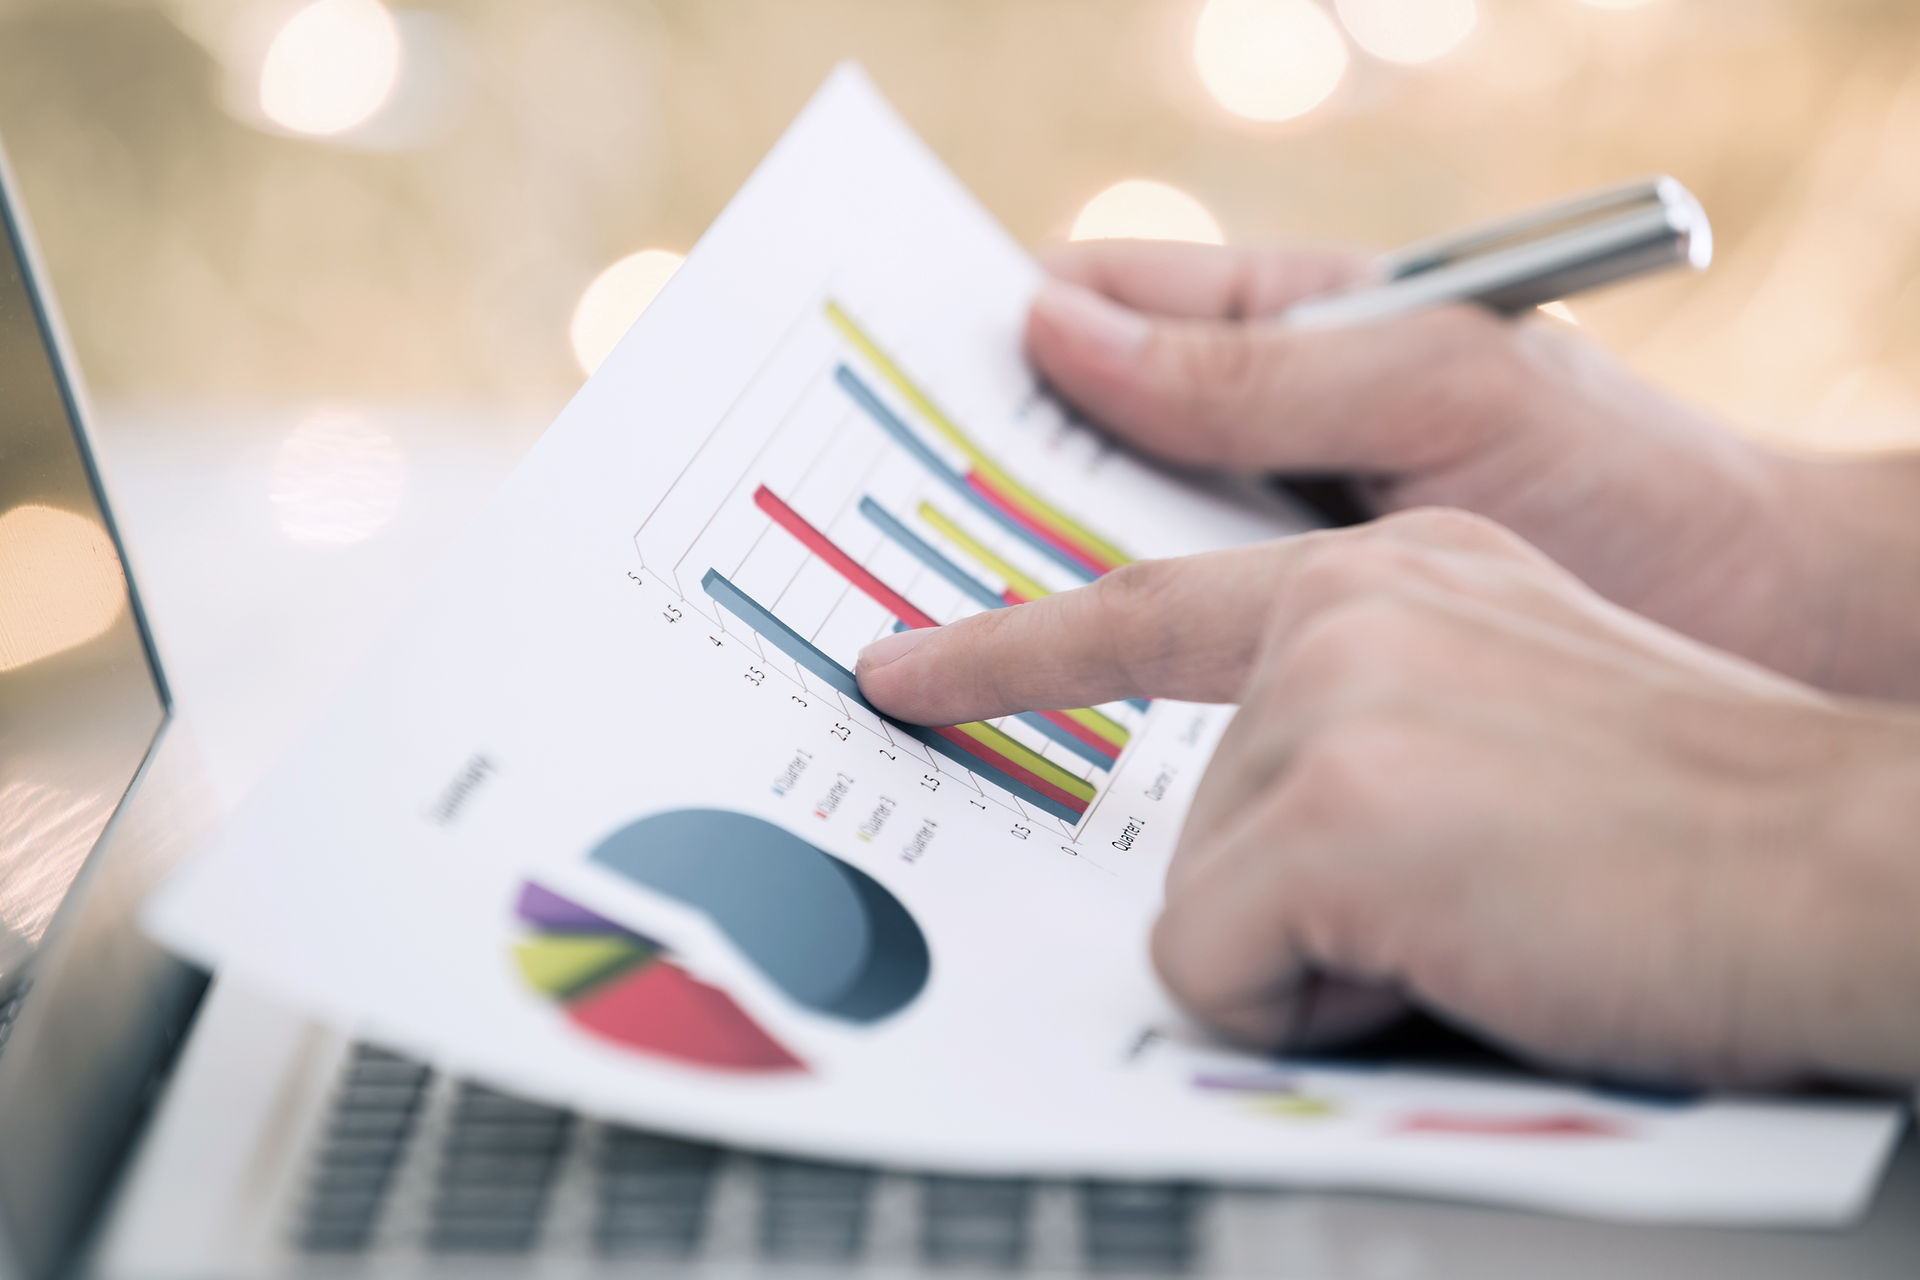
DASHBOARD AND REPORTS AUTOMATION
Market T Plus dedicated reporting team is well versed in understanding the business projects requirements. They prepare the quantitative or qualitative research based presentation in powerpoint, HTML for webcast and can be customized further into any customer specified format.
Our team is specialized in automating web or mobile based dashboards (i.e. bar, stacked, pie, pyramid, heat map, 3D charts etc.) to upload directly to a website to show real time data and maps. Manual hand outs are also a key area of specialization to produce charts and prepare primary and secondary research reports after the analytical findings. We use the latest technology tools for running analytical findings and for graphical representation, it is not only limited to SPSS, Excel, powerpoint, PDF, Tableau but many more advance tools for an efficient and meaningful graphical representation.

